Hello everyone,
In the last blog, I explained how to pre-process EMG data (If you haven’t checked it out, please go to my previous blog and YouTube video below).


The envelope we created last time is nice to see, but people may think “so what ?” Therefore, this time I would like to go further … Then, why do not we find when muscles activated, when they dropped out, and how long they activated ??
Procedure

1, Pre-process EMG data
We did this last time, so please check my previous blog and video below.
2, TKEO
TKEO stands for Teager–Kaiser energy operator, which can decrease noise so that we can identify muscle on and off easier later on. Technically, it “measures instantaneous energy changes of signals composed of time-varying frequency” (Solnik et al., 2010). The formula is …
() = ^2() − ( + 1) ∗ ( − 1)
Basically, you need to square a current data point and subtract a multiplication of a data point before and after the current data point. If a sequence of data points is 1, 2, 3, 4, 5, you need to leave the first and last data point and start from the second data point. Therefore, 2 in the second data point becomes 2^2 – 1*3, which is 1. 3 becomes 1. 4 becomes 1. Then, the sequence is 1, 1, 1, 1, 5 after TKEO. A plot after TKEO looks like this …
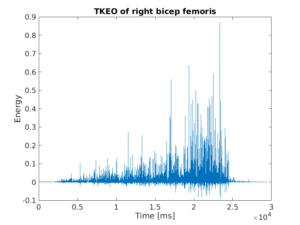
You can see that resting muscle EMG is close to 0, but activated muscle EMG is far away from 0. This makes it easy for us to detect muscle on and off later on.
3, Find threshold
A threshold is a certain value to identify muscle on and off. For example, I can say that the first point which a value becomes more than 10 is muscle on. In that case, 10 is the threshold. There are so many ways to identify the threshold, but in this time, I tried 3 different ways: A threshold with TKEO, A threshold without TKEO, and My adjusted TKEO.
The first 2 methods are based on research paper. The first one requires you to conduct TKEO on bandpass filtered EMG data. Then, you need to apply low-pass filter with 50 Hz cutoff frequencies and rectification. The data is now ready to find threshold. The formula is …
Threshold= + * σ
is a mean of baseline EMG (Resting muscle EMG)
is a coefficient which varies depending on EMG data (You may have to play around to find the best fit for your data)
σ is a standard deviation of baseline EMG (Resting muscle EMG)
Research paper used 15 for the coefficient (), but it did not work in this EMG data. Therefore, I used 20 instead.
The second method is without TKEO. I just used the threshold formula above on bandpass filtered EMG data. Research paper used 3 for the coefficient (), but it did not work in this EMG data. Therefore, I used 10 instead.
The third method is 2% of the maximum of TKEO data. The formula is …
Threshold = max(TKEO) * 0.02
4, Find muscle on and off
After defining the threshold, we can find when a muscle started activation and when it was ended. Plots below show muscle on and off detections in different threshold methods …
The first method (With TKEO)

The second method (Without TKEO)
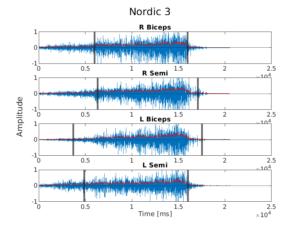
The third method (My adjusted TKEO)

Although the first 2 methods are based on research paper, the last one looks better than them. The last one is still not perfect, but it captures muscle on and off where they are supposed to be. As you may already know, there is no universal method to detect muscle on and off. You probably have to play around with a threshold with your data to find the best fit.
5, Find muscle activation duration
Once you find muscle on and off, you can find how long muscle activation lasted. It is easy. You just need to subtract muscle off from muscle on. A bar plot below shows the duration of each muscle activation in each trial …
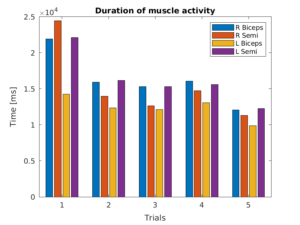
As you can see, the first trial has the longest activation duration, and the fifth is the shortest (Maybe fatigue plays a role??). Also, there is a pattern like right bicep femoris and left semitendinosus are longer than right semitendinosus and left bicep femoris in activation duration except for the first trial. Moreover, right semitendinosus activated longer than left bicep femoris.
If you want to enhance the plot, you can create a plot like below …
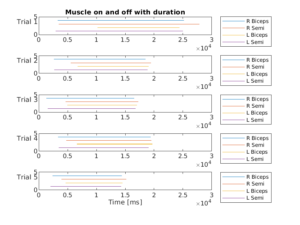
Now you can see muscle on / off and duration at the same time. It is interesting that muscle on varies, but muscle off is almost same among all different muscles in all trials.
My YouTube video
I am explaining all procedures above on my YouTube video, so check it out !!
MATLAB code and EMG data
Enjoy !!


Excellent post! We are linking to this great content on our site. Keep up the great writing. Hedda Leicester Sackville
Excellent work, I just finished data recording, and try to deal with it.
Sorry for troule you, the code attached couldnot work, could you update it again?
Thanks very much.
Thanks again! I find it in next attached files
I am glad you liked my post!