Hello everyone,
Have you ever wondered if you can compare the Premier league with Bundesliga ?? You can watch the Champions or Europa league and see which league a winning team comes from, but it does not represent a whole league …
In this blog, I will show you how to compare a number of shots, shots on target, corner kicks, fouls, yellow cards, and red cards among Bundesliga, Premier League, Serie A, La Liga, Ligue 1, and Scottish Premier League !!
Procedure

1, Importing data
You can download the data from “Football-data“. You just need to click a country on the left column and download any season of the league. In this blog, I use “Season 2019/2020”.
2, Find variables
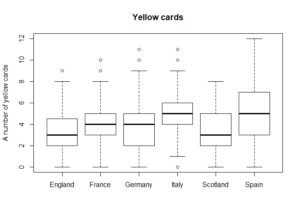
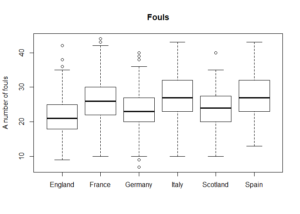
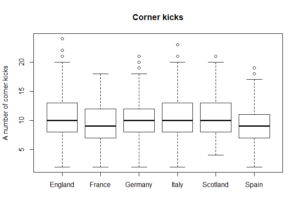
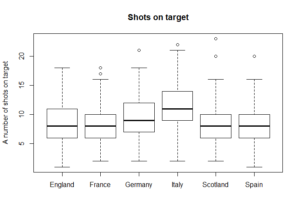
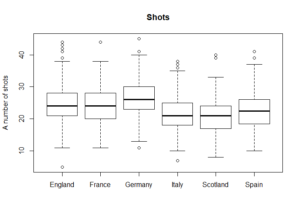
In this blog, I will use a total number of shots, shots on target, corner kicks, fouls, yellow cards, and red cards in each game. Let’s look at boxplot to see overview !!
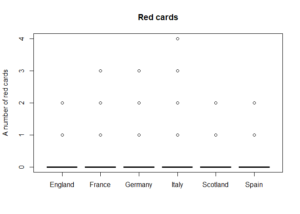
As you see, the boxplot of red cards is weird. It is just because a red card is such a rare case. I keep the variable, but you may not get meaningful results after ANOVA and post hoc test from the red cards. For other variables, it seems that there are some differences among different leagues. Let’s check it out !!
3, Statistical test
ANOVA
You can compare multiple variables by using ANOVA. It is like you conduct T-tests of each pair of leagues such as comparing a number of shots in Bundesliga with La Liga … etc. Results are below …
| Variables | F statistics P-value |
| Shots | 5.0170e-47 |
| Shots on target | 9.2773e-59 |
| Corner kicks | 1.4102e-09 |
| Fouls | 1.4226e-62 |
| Yellow cards | 4.4937e-51 |
| Red cards | 6.5327e-04 |
You may ask what is “e-…” ?? That is nothing scary. The symbol represents how many times you have to move decimals to the left. For example, if it is “1.234e-2”, it is 0.01234. The equation is technically 1.234 * 10^-2. For p-value reading, the symbol is often used when the value is very small. Therefore, you can just say that null hypothesis is rejected whenever you see the symbol. For this case, all p-values are less than 0.05, so the null hypothesis is rejected for all variables. Then, your next question would be “What does it mean??” Rejecting null hypothesis in ANOVA simply means that at least a pair of groups is statistically significantly different. In soccer league, at least a pair of leagues such as a number of shots in Premier league vs Bundesliga is different. It is good to know, but the problem is we do not know which pair yet. That is why we have to the post hoc test.
Tukey test (Post hoc test)
There are many ways to do the post hoc test. Tukey test is just one of them. It shows you all pairs of groups and tells you which pair is statistically significantly different. Let’s look at results … (It is a lot, so if you just want to see its summary, just skip all tables below …)
| Fouls | |||||
| Country 1 | Country 2 | 95% CI low | Difference | 95% CI high | P-value |
| England | France | -5.82922179 | -4.530626297 | -3.232030804 | 2.06758E-08 |
| England | Germany | -3.171888019 | -1.906759546 | -0.641631073 | 0.00025255 |
| England | Italy | -7.276524957 | -6.081578947 | -4.886632937 | 2.06758E-08 |
| England | Scotland | -3.859794514 | -2.366612761 | -0.873431008 | 9.18479E-05 |
| England | Spain | -7.181788115 | -5.986842105 | -4.791896095 | 2.06758E-08 |
| France | Germany | 1.260413656 | 2.623866751 | 3.987319846 | 6.37698E-07 |
| France | Italy | -2.849548144 | -1.55095265 | -0.252357157 | 0.008715905 |
| France | Scotland | 0.586659411 | 2.164013536 | 3.741367661 | 0.001297406 |
| France | Spain | -2.754811301 | -1.456215808 | -0.157620315 | 0.017526033 |
| Germany | Italy | -5.439947875 | -4.174819401 | -2.909690928 | 2.06758E-08 |
| Germany | Scotland | -2.009771224 | -0.459853215 | 1.090064794 | 0.958927393 |
| Germany | Spain | -5.345211033 | -4.080082559 | -2.814954086 | 2.06758E-08 |
| Italy | Scotland | 2.221784434 | 3.714966186 | 5.208147939 | 2.06924E-08 |
| Italy | Spain | -1.100209168 | 0.094736842 | 1.289682852 | 0.999919876 |
| Scotland | Spain | -5.113411097 | -3.620229344 | -2.127047591 | 2.07392E-08 |
| Corner kicks | |||||
| Country 1 | Country 2 | 95% CI low | Difference | 95% CI high | P-value |
| England | France | 0.206809 | 0.995586 | 1.784363 | 0.004353 |
| England | Germany | -0.15796 | 0.610492 | 1.378941 | 0.208974 |
| England | Italy | -0.66266 | 0.063158 | 0.788977 | 0.999873 |
| England | Scotland | -0.83858 | 0.068392 | 0.975362 | 0.999937 |
| England | Spain | 0.742602 | 1.468421 | 2.19424 | 1.41E-07 |
| France | Germany | -1.21327 | -0.38509 | 0.443078 | 0.77117 |
| France | Italy | -1.7212 | -0.93243 | -0.14365 | 0.009831 |
| France | Scotland | -1.88529 | -0.92719 | 0.030903 | 0.064448 |
| France | Spain | -0.31594 | 0.472835 | 1.261612 | 0.526209 |
| Germany | Italy | -1.31578 | -0.54733 | 0.221115 | 0.325278 |
| Germany | Scotland | -1.48353 | -0.5421 | 0.399332 | 0.571212 |
| Germany | Spain | 0.08948 | 0.857929 | 1.626378 | 0.018341 |
| Italy | Scotland | -0.90174 | 0.005234 | 0.912204 | 1 |
| Italy | Spain | 0.679444 | 1.405263 | 2.131082 | 5.31E-07 |
| Scotland | Spain | 0.493059 | 1.400029 | 2.306999 | 0.000158 |
| Red cards | |||||
| Country 1 | Country 2 | 95% CI low | Difference | 95% CI high | P-value |
| England | France | -0.23922 | -0.13248 | -0.02573 | 0.005427 |
| England | Germany | -0.16531 | -0.06132 | 0.042673 | 0.544876 |
| England | Italy | -0.2377 | -0.13947 | -0.04125 | 0.000738 |
| England | Scotland | -0.21661 | -0.09387 | 0.028867 | 0.247299 |
| England | Spain | -0.20612 | -0.10789 | -0.00967 | 0.021596 |
| France | Germany | -0.04092 | 0.071157 | 0.183231 | 0.459606 |
| France | Italy | -0.11374 | -0.007 | 0.099743 | 0.999969 |
| France | Scotland | -0.09105 | 0.038606 | 0.168261 | 0.958301 |
| France | Spain | -0.08216 | 0.02458 | 0.131322 | 0.986538 |
| Germany | Italy | -0.18215 | -0.07816 | 0.025835 | 0.265763 |
| Germany | Scotland | -0.15995 | -0.03255 | 0.094848 | 0.978538 |
| Germany | Spain | -0.15057 | -0.04658 | 0.057414 | 0.798079 |
| Italy | Scotland | -0.07713 | 0.045604 | 0.168341 | 0.897585 |
| Italy | Spain | -0.06664 | 0.031579 | 0.129801 | 0.942521 |
| Scotland | Spain | -0.13676 | -0.01403 | 0.108711 | 0.999516 |
| Shots | |||||
| Country 1 | Country 2 | 95% CI low | Difference | 95% CI high | P-value |
| England | France | -0.856772687 | 0.390350877 | 1.637474441 | 0.948563811 |
| England | Germany | -3.020710618 | -1.805727554 | -0.59074449 | 0.000328772 |
| England | Italy | 2.428733394 | 3.576315789 | 4.723898185 | 2.06758E-08 |
| England | Scotland | 2.63046925 | 4.064466333 | 5.498463417 | 2.06758E-08 |
| England | Spain | 0.976101815 | 2.123684211 | 3.271266606 | 2.00762E-06 |
| France | Germany | -3.505488861 | -2.196078431 | -0.886668001 | 2.59485E-05 |
| France | Italy | 1.938841348 | 3.185964912 | 4.433088476 | 2.06797E-08 |
| France | Scotland | 2.159282309 | 3.674115456 | 5.188948603 | 2.0738E-08 |
| France | Spain | 0.486209769 | 1.733333333 | 2.980456897 | 0.001053761 |
| Germany | Italy | 4.16706028 | 5.382043344 | 6.597026407 | 2.06758E-08 |
| Germany | Scotland | 4.381709381 | 5.870193888 | 7.358678394 | 2.06758E-08 |
| Germany | Spain | 2.714428701 | 3.929411765 | 5.144394828 | 2.06758E-08 |
| Italy | Scotland | -0.945846539 | 0.488150544 | 1.922147627 | 0.927458731 |
| Italy | Spain | -2.600213974 | -1.452631579 | -0.305049183 | 0.00418964 |
| Scotland | Spain | -3.374779206 | -1.940782123 | -0.50678504 | 0.001603427 |
| Shots on target | |||||
| Country 1 | Country 2 | 95% CI low | Difference | 95% CI high | P-value |
| England | France | -0.50477 | 0.213082 | 0.930939 | 0.958847 |
| England | Germany | -1.77354 | -1.07418 | -0.37483 | 0.000175 |
| England | Italy | -3.52635 | -2.86579 | -2.20523 | 2.07E-08 |
| England | Scotland | -0.62738 | 0.198045 | 1.023467 | 0.983794 |
| England | Spain | 0.042072 | 0.702632 | 1.363191 | 0.029371 |
| France | Germany | -2.04097 | -1.28727 | -0.53356 | 1.68E-05 |
| France | Italy | -3.79673 | -3.07887 | -2.36102 | 2.07E-08 |
| France | Scotland | -0.88699 | -0.01504 | 0.856915 | 1 |
| France | Spain | -0.22831 | 0.489549 | 1.207406 | 0.375535 |
| Germany | Italy | -2.49096 | -1.79161 | -1.09225 | 2.07E-08 |
| Germany | Scotland | 0.415441 | 1.272228 | 2.129014 | 0.000334 |
| Germany | Spain | 1.077458 | 1.776815 | 2.476171 | 2.07E-08 |
| Italy | Scotland | 2.238411 | 3.063834 | 3.889257 | 2.07E-08 |
| Italy | Spain | 2.907861 | 3.568421 | 4.228981 | 2.07E-08 |
| Scotland | Spain | -0.32084 | 0.504587 | 1.33001 | 0.503758 |
| Yellow cards | |||||
| Country 1 | Country 2 | 95% CI low | Difference | 95% CI high | P-value |
| England | France | -0.9129 | -0.45024 | 0.01243 | 0.061818 |
| England | Germany | -1.10465 | -0.6539 | -0.20316 | 0.00051 |
| England | Italy | -2.16258 | -1.73684 | -1.3111 | 2.07E-08 |
| England | Scotland | -0.45311 | 0.078889 | 0.610882 | 0.99829 |
| England | Spain | -2.20469 | -1.77895 | -1.35321 | 2.07E-08 |
| France | Germany | -0.68944 | -0.20367 | 0.282105 | 0.839583 |
| France | Italy | -1.74927 | -1.28661 | -0.82394 | 2.07E-08 |
| France | Scotland | -0.03286 | 0.529124 | 1.091107 | 0.078592 |
| France | Spain | -1.79138 | -1.32871 | -0.86605 | 2.07E-08 |
| Germany | Italy | -1.53368 | -1.08294 | -0.6322 | 2.08E-08 |
| Germany | Scotland | 0.180585 | 0.732793 | 1.285001 | 0.002157 |
| Germany | Spain | -1.57579 | -1.12504 | -0.6743 | 2.07E-08 |
| Italy | Scotland | 1.283737 | 1.815731 | 2.347724 | 2.07E-08 |
| Italy | Spain | -0.46784 | -0.04211 | 0.383633 | 0.999762 |
| Scotland | Spain | -2.38983 | -1.85784 | -1.32584 | 2.07E-08 |
Summary of the Tukey test
Fouls: England < Germany < Scotland < France < Italy = Spain
England has the least fouls. Italy and Spain are not statistically different in a number of fouls. The biggest difference is between England and Italy, which is 6 more fouls in average in each game in Italy compared to England. In other words, other comparisons are less than 6 fouls.
Corner kicks: Spain = France < England = Scotland = Germany = Italy
Spain and France have a lower number of corner kicks than all other leagues. All difference is less than 2, so all comparisons are very close each other.
Red cards: Differences between all pairs of leagues are less than 1
It means that the differences may not be practically relevant… Since a red card is such a miner event, we may just ignore the difference even though there are some differences which are statistically significant.
Shots: Italy = Scotland < Spain < England = France < Germany
The biggest difference is about 6 shots, which Germany has about 6 more shots than Scotland in average in each game.
Shots on target: Spain < France = Scotland = England < Germany < Italy
Interestingly, a number of shots on target in Spain, France, and Scotland is not statistically significant as well as a number of shots on target in France, Scotland, and England is not statistically significant although there is statistically significant difference between Spain and England. It means that France and Scotland have a slightly a lower number of shots than England in average in each game.
Yellow cards: England = Scotland < France = Germany < Italy = Spain
I put a number of yellow cards in France is more than England and Scotland, but it is actually not statistically significant. However, France and Germany have statistically no difference in a number of yellow cards, so a number of yellow cards in France may be slightly lower than Germany.
Interpretation
Very interestingly, a number of shots in Italy is the lowest among all leagues, but a number of shots on target is the highest, which would mean that teams in Italy may focus on the quality of shots rather than just shooting. Also, as you might guess, a number of fouls and yellow cards are the highest in Italy and Spain, which would mean that those leagues may play more aggressively than other leagues.
My YouTube video
Please check my YouTube video to see how to conduct all procedures above !!
MATLAB code and Excel files
MATLAB and R code with excel files
Enjoy !!